Economics of the Body: Pricing, Contracts and Commercial Models That Separated Winners from Wannabes in 2025–26
Executive summary Between 2025 and 2026 the commercial humanoid industry crystallized around a small set of business-model archetypes. Companies that tied pricing to customers’ cash-flow (leases, RaaS...
Published by The Humanoid Race
Archived source unverified — no source link is available. The claims, figures and quotations have not been checked against an available source. Retained for historical context, not presented as newly verified reporting.
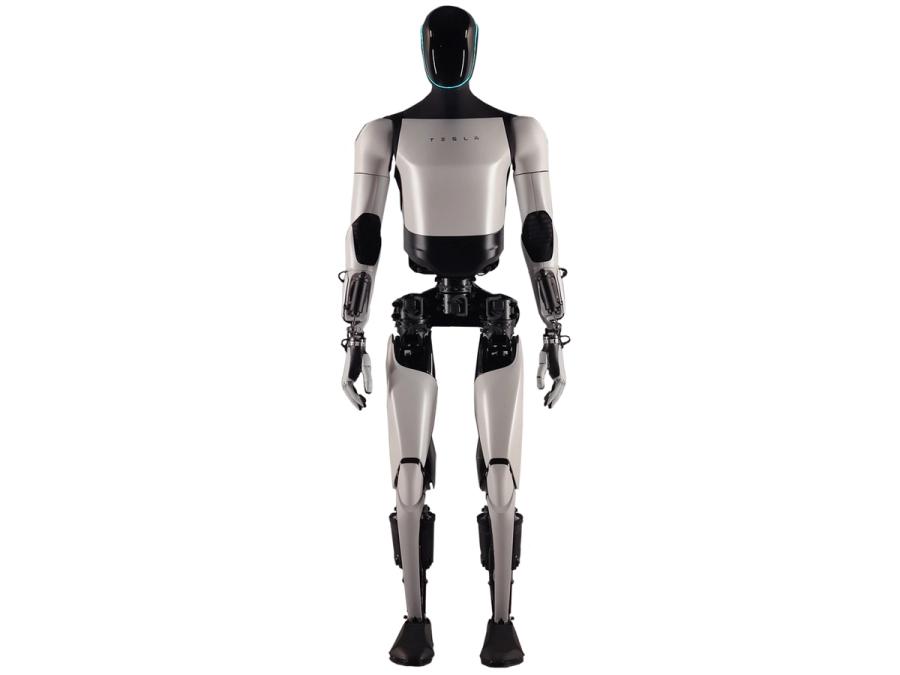
Executive summary Between 2025 and 2026 the commercial humanoid industry crystallized around a small set of business-model archetypes. Companies that tied pricing to customers’ cash-flow (leases, RaaS, outcome-based) shortened procurement cycles; those that combined hardware sales with software marketplaces captured higher lifetime value; and firms with deep capital or captive use cases (notably Tesla and large consumer brands) were able to subsidize early unit economics. Below I map the models used by leading players, present hypothetical but realistic modeled deal terms and sensitivity analysis, and forecast which go‑to‑market (GTM) approaches were likeliest to scale from 2026–28. Archetypes and company strategies (2025–26) Tesla — internal‑first, bundling and deferred public sales Positioning: Tesla pursued an internal‑deployment-first strategy, prioritizing factory and Gigafactory automation while presenting Optimus as a strategic asset rather than a mass-market product. Public pricing remained secondary to reliability and integration with Tesla’s vertically integrated software/hardware stack. Use cases: vehicle final assembly, battery module handling, logistics within Tesla campuses. Commercial implications: no meaningful public RaaS in 2025–26; Tesla’s effective “bundle” was productivity gains captured internally. That reduced go‑to‑market costs but limited Third‑party aftermarket revenue. Figure AI and Apptronik — hybrid capex + SLA industrial contracts Positioning: industrial-first: sell hardware with an associated multi‑year service level agreement (SLA). Marketing emphasized predictable uptime, deterministic cycle times, and integrations with existing automation. Example deal structure (modeled): upfront sale $100k/unit + $3k/month SLA. Maintenance included; aftermarket software (controls, skills) ~$8k/year. Use cases and pilots: parts kitting, machine tending, heavy pick/pack in automotive and electronics plants. Publicly reported pilots focused on replacing manual repetitive tasks where human ergonomics were limiting throughput. Agility Robotics — channel-led leases and revenue‑share pilots Positioning: channel‑led wholesaling to 3PLs and integrators, with lease programs and revenue‑share pilots to lower adoption barriers. Sales teams worked with logistics integrators to embed humanoids into customer workflows. Example deal structure (modeled): $4k/month lease (maintenance included) or lease + 15% of realized labor savings in revenue‑share pilots. Use cases: last‑mile sorting, cross‑dock handling, evening shifts at 3PLs. Pilots focused on cost avoidance from wage volatility and rapid scale-up during peak seasons. 1X Technologies — task‑specific attachments + pay‑per‑task Positioning: low‑upfront hardware or rented base unit with higher‑margin, task‑specific attachments (grippers, vacuums) and pay‑per‑task pricing for high‑volume repeatable tasks. Example deal structure (modeled): attachment $10k, pay‑per‑task $0.50 (typical annual volume 100k tasks → $50k/year). Target sectors: retail replenishment, pharmacy fulfillment. Sanctuary — long‑term outcome‑based contracts for healthcare Positioning: sell clinical outcomes rather than machines. Contracts linked fees to measurable metrics (reduced nurse hours, lower fall rates, readmission reductions) and required multi‑year agreements with healthcare systems. Example deal structure (modeled): per‑unit service fee + shared savings; typical realized revenue per unit when outcomes met ~ $64k/year. High sales friction, but sticky long‑term contracts when validated. Xiaomi / UBTECH — consumer financing and subscription add‑ons Positioning: consumer distribution channels, low hardware price, and monetization via financing (0% APR 24–36 month plans) and subscriptions for skills, voice‑services, and smart‑home integrations. Example deal structure (modeled): hardware $2k; financing ≈ $50/month; subscriptions $5–15/month. Scale dependent—needed hundreds of thousands of units to produce material profits. Low‑cost entrants — low‑entry hardware sales Positioning: drive adoption through the lowest upfront price. Minimal aftermarket revenue; sell into hobbyist, education, and very price‑sensitive small retail segments. Unit economics, modeled deal terms and sensitivity The following table summarizes representative modeled terms and a simple break‑even analysis against an illustrative fixed cost burden of $100M/year (R&D, SG&A and platform ops). Numbers are hypothetical, calibrated to industry reporting and real pilot outcomes where available. Archetype Typical deal (first year) Maintenance / year Aftermarket / SW rev year Net annual contribution per unit Break‑even units for $100M/year Tesla (internal) Internal deployment; not monetized ~$6k (internal ops) Low (internal integration) Captured as internal savings (~$80k/yr) Not applicable (internal ROI) Figure / Apptronik (hybrid) $100k upfront + $3k/mo $12k $8k ~$132k ~758 units Agility (lease / rev‑share) $4k/mo lease (or lease + rev‑share) $8k (included) $5k ~$45k (baseline); ~67.5k (with rev‑share) ~2,222 (baseline); ~1,481 (rev‑share) 1X Technologies (pay‑per‑task) Attachment $10k + $0.50/task $6k $3.3k (ammortized attachment) ~$47.3k ~2,115 Sanctuary (outcome‑based) Outcome contract, realized ~$64k/yr $10k $6k ~$54k ~1,852 Xiaomi / UBTECH (consumer) $2k sales + $30–50/mo subs $200 $120–360 ~$2.3k ~42,900 Low‑cost entrants $1k one‑time $50–150 ~$50 ~$1.05k ~95,200 Sensitivity notes: industrial hybrid models begin to scale profitably at several hundred to a few thousand deployed units if SLA and aftermarket uptake are maintained. Lease models require larger installed bases or revenue‑share uplifts to justify heavy capital deployment. Consumer and ultra‑low‑cost approaches only become materially profitable at very large volumes (tens of thousands) or with high ARPU subscriptions. Aftermarket revenue, servicing and financing effects Aftermarket software and skills marketplaces drove disproportionate lifetime value for companies with proprietary control stacks (Figure, Apptronik) — a single large integrator could add $5k–$15k/year per unit in software revenue once skills and integrations were certified. Parts and maintenance were major cost drivers: industrial humanoid parts & field service averaged $8k–$15k/year; consumer units were under $500/year. Predictable SLA pricing improved purchase acceptance in 2025–26 by shifting risk to vendors. Financing (leases, RaaS) materially lowered procurement friction. Leases and RaaS allowed customers to treat humanoids as operating expenses and were essential to adoption in logistics and manufacturing. Competitive positioning and who benefits from which moat Proprietary hardware advantage: Tesla (integration with vehicle and energy manufacturing), Figure and Apptronik (rugged industrial frames)—these firms could optimize cost, reliability and performance at the component level. Software/Marketplace advantage: companies that opened skills marketplaces and APIs (Figure, Apptronik, and later Agility) had higher aftermarket monetization and stickiness. Capital depth advantage: Tesla and large consumer brands (Xiaomi, UBTECH) could subsidize early losses — Tesla by internalizing value, Xiaomi/UBTECH by using broad channels for scale. Vertical specialization advantage: Sanctuary (healthcare outcomes) and 1X (task attachments) benefited from narrow solution focus that simplified validation and regulatory compliance. Forecast: which GTM wins 2026–28 From 2026–28 the most scalable GTM approaches are those that (a) reduce buyer risk via financing or outcome guarantees and (b) capture recurring aftermarket revenue. Concretely: Hybrid capex + SLA (Figure / Apptronik) — most sustainable for industrial automation: reasonable upfront economics, faster path to aftermarket revenue, and fewer required units to cover fixed costs. Lease + revenue‑share (Agility) — effective for logistics where seasonal demand and variable labor costs make capex unattractive; requires strong channel partnerships and working‑capital funding. Outcome‑based (Sanctuary) — viable in regulated sectors (healthcare) where a validated outcome can be monetized; long sales cycles but high retention. Consumer and low‑cost plays — will remain volume stories; winners must either achieve massive unit sales or convert large installed bases into subscriptions to reach sustainable margins. In 2025–26 the split between winners and wannabes was less about the robot’s bipedal mechanics and more about financing, aftermarket capture and how contracts allocated operational risk. Conclusion Commercial traction in 2025–26 hinged on three levers: contract design that moved risk off the buyer, aftermarket monetization, and capital to bridge early losses. Firms that bundled hardware with durable SaaS/SLA revenue streams — and that could finance deployments to match customer cash-flow — required fewer deployed units to reach sustainable margins. Consumer‑focused models promise volume but demand scale. Vertical specialists can win pockets of profitable deployment but will be acquisition or partnership targets for platform players building broader software ecosystems.