Maintenance, Mindshare and Metrics: The True Cost Structure and Competitive Positioning of Humanoids in 2025–26
Executive summary Maintenance, Mindshare and Metrics became the deciding factors in the 2025–26 humanoid market. By that period, vendors that matched realistic pricing models to clear operational outc...
Published by The Humanoid Race
Archived source unverified — no source link is available. The claims, figures and quotations have not been checked against an available source. Retained for historical context, not presented as newly verified reporting.
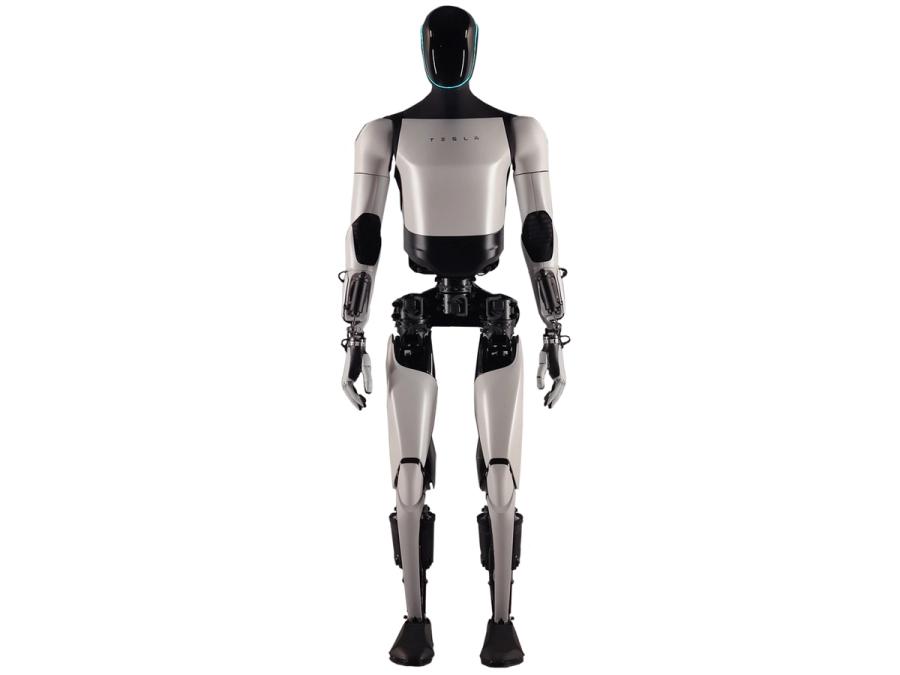
Executive summary Maintenance, Mindshare and Metrics became the deciding factors in the 2025–26 humanoid market. By that period, vendors that matched realistic pricing models to clear operational outcomes — and backed those promises with integrated services, safety certifications and insurance partnerships — gained traction. Hardware-only, low-margin strategies struggled when customers discovered the recurring costs and integration work required to realize promised productivity gains. Pricing approaches observed in 2025–26 Vendors experimented with multiple commercial models. Market winners were not always the lowest-cost hardware vendors; they were the vendors whose business model matched buyer procurement cycles and operations budgets. Up‑front capital sales — Traditional single-payment purchasing persisted for customers with CAPEX budgets and in-house maintenance teams. Typical hardware list prices ranged from a low-end Unitree/UBTECH educational/assistive humanoid equivalent at $10k–$40k to full-featured general-purpose humanoids (Apptronik, Sanctuary, Figure, Tesla Optimus-class positioning) quoted in public investor decks and briefings at a much higher range, often $50k–$250k depending on sensors and payload. Robot‑as‑a‑Service (RaaS) — Monthly subscriptions dominated enterprise pilots. RaaS pricing commonly fell between $2k–$15k per robot per month , with higher tiers for guaranteed uptime and on-site support. RaaS converted high CAPEX into predictable OPEX for logistics, retail and manufacturing customers. Bundled hardware+software subscriptions — Platform players (Tesla, Figure) pushed low initial hardware prices offset by mandatory software/vision compute subscriptions or per‑minute compute billing. These bundles often included developer access fees. Outcome‑based SLAs — A limited but fast-growing number of integrators offered pay‑for‑productivity contracts: price per completed pick, per hour of validated uptime, or per throughput uplift. These were most common where process metrics were easily measured (warehouse picking, last‑mile sorting). Hybrid leasing — Midway models included multi‑year leases with upgrade options; they were attractive to retail chains cycling hardware on 3–5 year refresh schedules. Representative contract economics (market norms in 2025–26) Model Typical term Monthly cost (per robot) Included services Up‑front sale One‑time $50k–$200k Limited warranty, optional maintenance contract RaaS 12–60 months $3k–$12k Remote monitoring, SW updates, some on‑site support Outcome SLA 12–36 months Variable (pay per task) Performance guarantees, penalties/bonuses Recurring cost drivers Enterprise buyers learned to evaluate Total Cost of Ownership across predictable and variable recurring costs: Maintenance and field service — Spares, periodic calibration and on‑site tech visits accounted for 10–30% of annual TCO for active deployments; labor rates in Western markets pushed this higher. Cloud compute and vision subscriptions — Platform players monetized inference and mapping in cloud; customers reported $200–$1,500 per robot per month in compute costs for large vision stacks. Replacement parts and consumables — End‑effectors, feet, motors and batteries; mean time between failures varied across vendors and was a key procurement differentiator. Integration services — System integrators charged from $50k for simple cell integration to >$1M for full plant automation; these services were often the largest single line item beyond hardware. Safety certification — Site‑level risk assessments, fencing or collaborative safety validation with insurers; costs varied but could be tens of thousands for complex sites. Revenue levers for vendors To offset hardware margin pressure, vendors leaned on recurring and platform revenues: Developer marketplaces — App stores for robot skills (navigation, picking) created new revenue share streams. Third‑party apps and integration fees — Systems integrators and ISVs paid to certify or bundle software. Data licensing — Aggregated anonymized operational data (cycle times, failure modes) was monetized to improve models and sold to partners. Uptime SLAs — Premium contracts for guaranteed availability added predictable recurring income. Competitive positioning: who won and why Three broad clusters emerged in 2025–26: Low‑cost makers (Unitree, UBTECH lines) Unitree and some UBTECH products competed on unit price for pilot programs, research and low‑complexity front‑office tasks. These players won on speed-to-deploy and low entry price for proofs‑of‑concept, but struggled to convince enterprise buyers to scale due to weaker durability, fewer enterprise integrations and limited safety certifications. High‑service, verticalized integrators (Apptronik, Sanctuary) Apptronik and Sanctuary focused on industrial and healthcare verticals, coupling robots with heavy services: process mapping, integration, and guaranteed outcomes. Their higher sticker prices were justified by shorter time‑to‑value and lower hidden integration costs. Where buyers demanded predictable ROI and insurer backing, these vendors took share. Platform players betting on scale (Tesla, Figure) Tesla and Figure pursued low‑margin hardware with a massive developer ecosystem and monetized software and compute subscriptions. Their success depended on broad adoption and active developer marketplaces. In 2025–26, this model showed promise in contexts where standardized tasks and high-volume deployment created network effects; it underperformed where bespoke system integration dominated. ROI expectations and contract metrics Sales teams standardized ROI pitches in 2025–26 to align with operations budgets: Payback windows — Conservative pilots targeted 12–36 months payback on installed cost including integration; optimistic sales decks claimed 6–12 months using aggressive FTE substitution numbers. FTE substitution assumptions — Vendors typically modeled 0.6–1.5 FTEs replaced per robot in warehousing and distribution, but independent audits often reduced that to 0.3–0.8 when factoring labor redeployment and supervision costs. Availability targets — 90–99% uptime SLAs were common; penalties or credits aligned incentives but increased vendor support costs. Practical lesson: buyers who insisted on third‑party audits of pilot metrics and staged rollouts captured more real productivity gains than those accepting vendor‑provided simulations. Non‑price battlegrounds As price converged, competition shifted to: Developer ecosystems and tooling — More mature SDKs, simulation tools and certification programs accelerated integrations. Safety certifications and insurer partnerships — Vendors with validated safety cases and insurance programs reduced deployment friction. Systems integrator networks — Partnerships with global integrators determined enterprise adoption speed. Strategic recommendations For buyers Evaluate TCO over 3–5 years, including maintenance, cloud, parts and integration — not just sticker price. Require pilot success criteria tied to measurable KPIs (throughput, error rate, downtime) and insist on independent validation. Prefer vendors offering clear upgrade paths, certified integrator networks and documented safety approvals to reduce hidden risk. For vendors Structure pricing to align with operations budgets: blended RaaS + outcome SLAs win over pure CAPEX in most enterprise accounts. Invest in developer tooling and a marketplace early — recurring software revenues are the lever that scales gross margins. Build and publicize safety certifications and insurer relationships; they are commercial differentiators as important as motor torque or battery life. In sum, the 2025–26 humanoid market rewarded vendors who treated robots not as one‑time hardware buys but as operational platforms — priced and packaged to erase hidden costs and deliver measurable, auditable outcomes.