Price per Step: Comparing Pricing Models, Service Economics and ROI for Humanoids in 2025–26
Executive summary By 2025–26 humanoid vendors have moved from prototype demos to commercial pilots, and the commercial debate has shifted from “can they walk?” to “how do you pay for them?” Manufactur...
Published by The Humanoid Race
Archived source unverified — no source link is available. The claims, figures and quotations have not been checked against an available source. Retained for historical context, not presented as newly verified reporting.
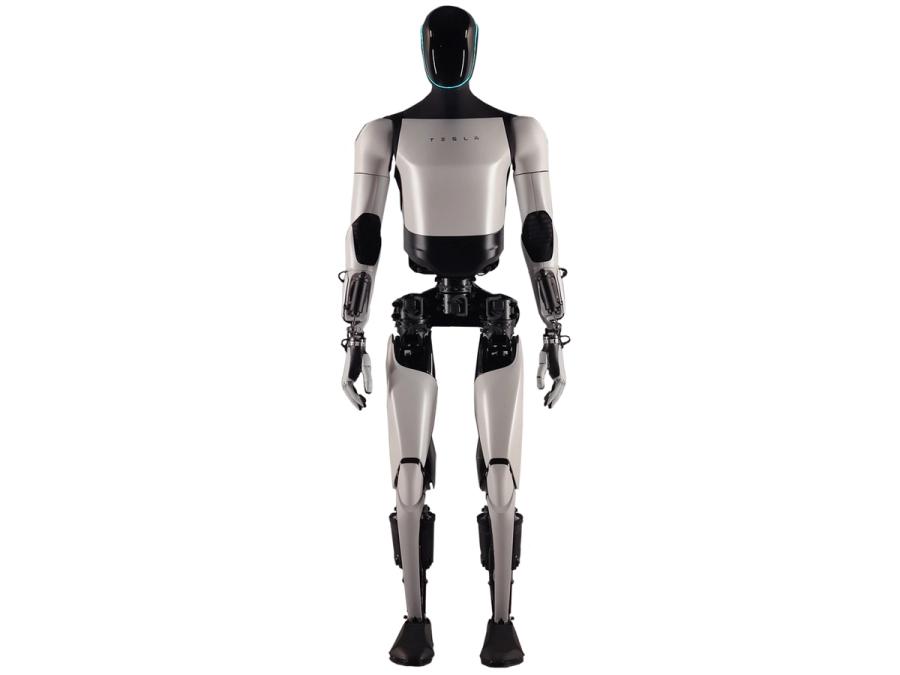
Executive summary By 2025–26 humanoid vendors have moved from prototype demos to commercial pilots, and the commercial debate has shifted from “can they walk?” to “how do you pay for them?” Manufacturers and service providers are offering a mix of capital sales, leasing, Robot‑as‑a‑Service (RaaS) subscriptions and performance‑based contracts. This study compares the economics and contract structures being used by Tesla, Figure, Agility Robotics, 1X Technologies, Apptronik, Sanctuary AI, Unitree and UBTECH, and models representative total cost of ownership (TCO) outcomes for four common deployments: warehouse order picking, factory kitting, eldercare assistance and home concierge. How vendors are positioning their offers Tesla : positioning Optimus as factory‑first hardware sold to large manufacturers, with later RaaS pilots; marketing emphasizes integration into Tesla factories and eventual fleet services. Figure : selling humanoids as higher‑margin services for healthcare and hospitality, leaning on subscription and managed‑service contracts tied to uptime and task throughput. Agility Robotics : historically focused on logistics; sells hardware to integrators while offering RaaS pilots to warehouse operators. Marketing centers on pick-and‑place productivity and safety in mixed human environments. 1X Technologies and Apptronik : smaller manufacturers marketing flexibility — capex sales + optional cloud software subscriptions and system integrator partnerships. Sanctuary AI : enterprise and public sector focus; emphasizes long‑term services revenue, high SLAs and vertical customization (healthcare, assisted living). Unitree and UBTECH : Unitree primarily sells low‑cost hardware and leasing for research/education (quadruped heritage); UBTECH leverages consumer/education channels and leased concierge/entertainment deployments. Contract structures and pricing building blocks Across vendors contracts combine multiple elements: Capital cost (hardware list price): early commercial humanoids in 2025–26 are often high‑teens to mid‑six‑figure per unit list prices in press and analyst ranges. Vendors selling to OEMs (Tesla, some Apptronik deals) emphasize CAPEX sales. RaaS subscriptions : monthly fees replacing CAPEX, typically tiered by utilization, often in the mid‑thousands to low‑tens‑of‑thousands per robot per month in announced pilot terms and industry estimates. Integration & software licensing : one‑time integration fees (systems integrator work, vision/warehouse mapping) and recurring cloud/AI licensing (per‑robot or per‑site). Maintenance, battery‑swap & consumables : annualized contracts or pay‑per‑swap subscriptions. Vendors increasingly guarantee swap turnaround as part of SLA. Warranties & SLA : uptime SLAs (e.g., target 90–98% availability), with credits or performance fees if missed. Higher SLA levels attract premium pricing or service provider margins. Margin and financing dynamics Manufacturers face hardware gross margins in the 10–30% band on early units and push services to lift lifetime gross margin to 40–60%. Independent service providers (RaaS operators, integrators) target recurring margins above 30–40% after scale. Financing partners (specialized lessors and large banks) and insurers (large multiline carriers and specialty units within Munich Re / Allianz) are increasingly underwriting uptime and residual values to enable RaaS and leasing. Sample TCO scenarios (modeled) The following table presents four illustrative, modeled 5‑year TCOs. These are scenario models based on industry observed contract structures and public signals; numbers are assumptions for comparative purposes. Scenario Assumptions (capex / integration / maintenance) Key labor replaced 5‑yr TCO (CAPEX buy) 5‑yr TCO (RaaS) Break‑even vs labor Warehouse order picking Capex $150k; integration $50k; maintenance 12%/yr; cloud $12k/yr 1 FTE @ $50k/yr equivalent per robot $150k + $50k + ~ $150k (maintenance/license) = ~$350k RaaS $7k/mo = $420k over 5 yrs (inc. maintenance) CAPEX buy breaks even in ~3.5–4 yrs at 80–90% utilization Factory kitting Capex $120k; integration $80k (line integration); maintenance 10%/yr Partial substitution of skilled kitters; productivity uplift 1.3x ~$320k 5‑yr RaaS $6k/mo → $360k 5‑yr Breakeven ~4–5 yrs, faster where robots free human time for higher value tasks Eldercare assistance (facility) Capex $180k; soft customization $75k; SLA premium; maintenance 15%/yr Augmentation (not full headcount replacement); reduces night‑shift FTEs by 0.3–0.6 ~$420k 5‑yr RaaS $9–12k/mo → $540–720k 5‑yr Typically >5 yrs to payback via headcount substitution; ROI driven by quality metrics/retention Home concierge (consumer pilot) Capex $80k consumer/concierge price; recurring service $200–400/mo Augmentation (no direct wage replacement); value = time savings + subscription ~$80–100k up front + support Subscription $300/mo → $18k 5‑yr Not a labor replacement; payback via service revenues for vendors, not consumers These modeled scenarios show that high utilization (multi‑shift warehouse work) materially shortens payback. In eldercare and home uses, benefit is often qualitative (safety, staff retention) rather than headcount substitution. Sensitivity: utilization, uptime and substitution math Two levers dominate ROI: effective utilization (hours/day actively working) and substitution rate (how many FTEs displaced per robot). Warehouse deployments move ROI quickly when robots operate 16–24 hours/day in multi‑shift sites; a robot replacing one $50k/yr picker reaches payback much faster at 18‑hour utilization than at single‑shift use. At 80% uptime and 16 hours/day, a $350k 5‑yr CAPEX robot replaces one $50k/yr worker in ~3.5 yrs. At 40% uptime and single‑shift use, payback often exceeds 7–8 years—shifting buyers toward RaaS and pilot credits. Negotiation levers and commercial structures Buyers and vendors use familiar levers: Pilot‑to‑scale credits : pilot discounted or partially subsidized, with conversion credits applied to enterprise purchase or first year of RaaS. Performance‑based fees : fee tied to picks/hour or dwell reduction; common in logistics pilots from Agility and other vendors. Leasing & residual guarantees : third‑party lessors reduce CAPEX friction; residual guarantees help lower monthly payments. Insurance underwriting : availability and cyber/physical risk coverages reduce buyer risk and often convince enterprise buyers to accept higher SLA premiums. Procurement tip: insist on utilization‑based pricing bands, pilot conversion credits, and clear residual value estimates. Model both CAPEX and RaaS over 5 years and stress test for 50% vs 90% utilization. Competitive map and vendor objectives Vendor Primary go‑to‑market Business focus Tesla OEMs, factories CAPEX sales, later RaaS for high‑volume factory automation Figure Healthcare, hospitality Managed services / subscriptions, high‑margin services Agility Robotics Logistics & retail RaaS pilots + hardware sales to integrators Apptronik / 1X Industry integrators, niche apps Hardware + software licensing; integrator partnerships Sanctuary AI Enterprise & public sector Long‑term services and vertical customization Unitree / UBTECH Research, consumer, education, concierge Lower price points, leasing, volume and channel reach Conclusions and procurement guidance Humanoids in 2025–26 are not yet plug‑and‑play commodity assets. Procurement teams should: Model both CAPEX and RaaS with 5‑year horizons and utilization sensitivity (50%/75%/90%). Negotiate pilot credits and explicit conversion terms to cap integration risk. Prioritize SLA metrics aligned to business KPIs (throughput, picks/hour, time‑to‑assist) and link a portion of fees to performance. Use third‑party financing and residual guarantees to reduce upfront budget impact where CAPEX is otherwise prohibitive. Vendors chasing volume (Unitree, UBTECH) compete on price and channel; enterprise margin plays to companies that sell CAPEX + integration (Tesla, Apptronik); long‑term services and recurring revenue are the strategic prize for Figure, Sanctuary and Agility. Ultimately buyers will choose pricing models that match utilization profiles: subscription for flexible, low‑commitment pilots and high‑utilization RaaS for logistics; CAPEX plus software for deep OEM integration in factories.