Price, Platform, Partnerships: A Comparative Economics Playbook for Procuring Humanoids in 2025–26
Executive summary Procurement for humanoid robots in 2025–26 is a capital- and integration-heavy decision: vendors sell platform potential as much as a product. This analysis translates vendor claims...
Published by The Humanoid Race
Archived source unverified — no source link is available. The claims, figures and quotations have not been checked against an available source. Retained for historical context, not presented as newly verified reporting.
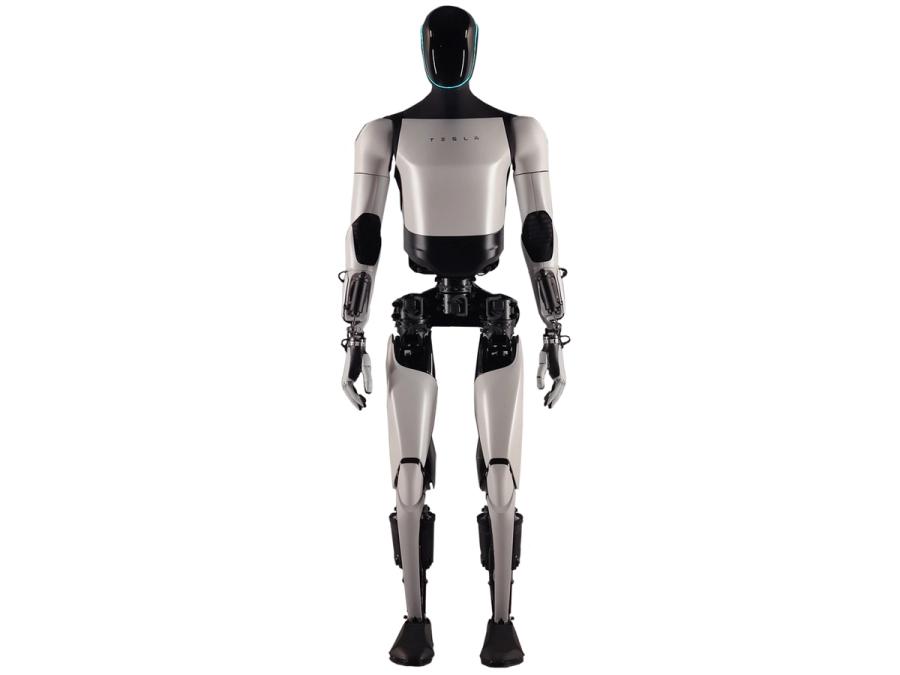
Executive summary Procurement for humanoid robots in 2025–26 is a capital- and integration-heavy decision: vendors sell platform potential as much as a product. This analysis translates vendor claims into practical unit economics and total cost of ownership (TCO) across four prototypical 2025–26 use cases — 24/7 warehouse order fulfillment, high‑mix light assembly, skilled eldercare in assisted‑living, and consumer/home companionship — comparing public offers, reported pilots and plausible pricing ranges for Tesla (Optimus), Agility Robotics (Digit), Figure AI, 1X Technologies (NEO/EVE), Apptronik (Apollo), Sanctuary AI (Phoenix), Xiaomi (CyberOne), UBTECH, and adjacent players (Unitree quadrupeds, Fourier Intelligence medical rehab adjuncts). Assumptions and modeling approach Capex amortization: straight‑line over 5 useful years (conservative for early platforms). Service & maintenance: SLA and spare parts cost estimated at 10–25% of capex annually depending on vendor maturity. Integration & software: one‑time deployment engineering equal to 0.5–2.0× device cost for complex sites (higher for high‑mix assembly). Labor baseline: $18–30/hr (North America/W. Europe warehouses), caregiver wage $25–40/hr; home consumer value measured as willingness‑to‑pay/RaaS subscription. Productivity uplift: vendor claims scaled by independent analyst adjustment: optimistic uplift = vendor claim, base case = 50–75% of claim. Vendor indicative economics (summary) Vendor / Platform Indicative list price / RaaS (monthly) Expected substitution / uplift range Annual service % of capex Lifecycle (yrs) Resale value (after 3 yrs) Tesla (Optimus) Indicative: $20k–$50k / RaaS $3k–$8k Warehouse 40–70% pick tasks (demo‑led claims) 12–20% 5–7 20–40% Agility Robotics (Digit) Indicative: $75k–$150k / RaaS $6k–$12k Logistics/tote handling 30–60% 15–25% 4–6 10–30% Figure AI Indicative: $50k–$150k / RaaS $5k–$10k General tasks 30–60% 15–25% 4–6 10–30% 1X Technologies (NEO/EVE) Indicative: $30k–$100k / RaaS $4k–$9k Service/assembly 20–50% 12–22% 4–6 10–30% Apptronik (Apollo) Indicative: $80k–$200k / RaaS $8k–$15k Assembly/inspection 25–55% 15–25% 5–7 15–35% Sanctuary AI (Phoenix) Indicative: $100k–$250k / RaaS $10k–$20k Skilled tasks 20–50% 18–30% 5–8 15–35% Xiaomi (CyberOne) Indicative: consumer $2k–$10k or subscription $50–300/mo Home assistance/companion marginal monetizable 5–15% 3–6 20–50% (secondary consumer market) UBTECH Indicative: $20k–$80k / RaaS $2k–$8k Service/retail 20–40% 10–20% 4–6 15–35% Unitree / quadrupeds $10k–$50k / RaaS $1k–$6k Freight/inspection 10–40% 10–20% 3–6 20–40% Fourier Intelligence (medical adjunct) Device pricing varies; service contracts common Rehab assistance 10–40% (clinical context) 12–25% 4–8 10–30% Use‑case economics and break‑even examples 1) 24/7 warehouse order fulfillment Scenario: 24/7 three‑shift warehouse where average picker wage = $22/hr including benefits. An Optimus or Digit class humanoid operating mainly as pick+place with 85% uptime can deliver 1.5–2.2× per‑unit throughput versus a single human for repetitive cartons. Under plausible pricing (Optimus $30k upfront, 12% annual service, integration 0.75× device cost), per‑robot hourly TCO including amortization (~$30k/5yrs) is roughly $6–10/hr. If robot replaces 0.6 FTE of a human ($22/hr), per‑robot payroll savings ≈ $13/hr — break‑even in 1.5–3 years depending on integration overhead. 2) High‑mix light assembly Assembly requires dexterity, fixture changeovers and QA. Apptronik, Sanctuary and Figure position themselves here. Because integration engineering is high (1–2× device cost) and productivity gains per station are more modest (20–50%), break‑even horizons extend to 3–6 years unless robots are used for multiple shifts or scaled across many lines. SLA and rapid retrofit capability (grippers, vision) are critical to protect uptime economics. 3) Skilled eldercare in assisted‑living facilities Here substitution is partial: lifts, monitoring, medication reminders, and documentation can be automated but emotional/clinical labor remains human. Typical caregiver wage $30/hr; robots deliver value via extended coverage (nights), fall detection and reduced injury claims. RaaS models (Sanctuary, Xiaomi for lower‑end assistance) are attractive: a $1,500–6,000/mo RaaS can be justified if it reduces one FTE per 10–30 beds or lowers contract nursing hours. TCO sensitivity hinges on liability, certification and local regulatory acceptance. 4) Consumer/home companionship/assistance Consumer economics are distinct: Xiaomi and UBTECH aim for low price points and subscriptions. Price elasticity and brand trust determine adoption: amortized buyer TCO must be well under current home care costs for seniors ($200–400/day commercial) to have mass appeal. Secondary market and upgradeability (OTA software) are decisive for long‑term resale value. Partnerships, contractual structures and sensitivity Systems integrators & WMS partners: warehouse deployments need WMS integration (Blue Yonder, Manhattan, SAP) and SIs to bridge robot APIs — budget 0.5–2× device cost. Telco/cloud: low‑latency connectivity (private 5G) and cloud compute (AWS/Azure/Alibaba) matter for fleet coordination and OTA upgrades. Capital vs OPEX: RaaS is favored to de‑risk early platforms; CAPEX may yield lower long‑term TCO but increases integration and uptime risk exposure. Sensitivity: break‑even timeline is most sensitive to labor rate (±20% changes produce comparable shifts in ROI horizon), utilization (single‑shift vs 24/7) and realized productivity uplift (50–75% of vendor claim in base case). Practical takeaway: procurement winners will be teams that aggressively price integration, demand performance SLAs, and structure payment to shift risk to vendors until platforms prove repeatable across multiple sites. Decision playbook — procurement checklist and pilot recommendations Procurement checklist: required KPIs (units picked per hour, mean time to repair, uptime %), explicit integration bounds (WMS APIs), data ownership and export access, service escalation matrix, spare parts delivery windows, cybersecurity attestations, and insurance/liability clauses. Contract clauses to demand: uptime SLAs with financial credits, phased acceptance tests tied to measured throughput, open interfaces for third‑party integrations, upgrade/obsolescence path (hardware trade‑in or credit), and clear IP/data ownership. Pilots to derisk (recommended 90–180 days): Warehouse: single zone 24/7 pilot measuring picks/hr, error rates, and downstream sortation impact. Assembly: multi‑station pilot with rapid changeover measuring cycle time delta and retool cost. Eldercare: night‑shift falls and monitoring pilot with clinical oversight to validate safety and acceptance. Home: subscription pilot with churn analysis and secondary‑market trial to validate resale assumptions. Final note: vendor roadmaps are evolving rapidly — buyers should treat 2025–26 as a hybrid phase (co‑robotics + human supervision) rather than full substitution. Negotiate for incremental scale‑out tied to real, measured productivity milestones rather than vendor rhetoric.