Unit Economics and the Race to Scale: The Business Models That Determined Humanoid Winners in 2025–26
Unit Economics and the Race to Scale: The Business Models That Determined Humanoid Winners in 2025–26 By 2026 the humanoid robotics market had moved from headline demos to hard commercial choices. Gr...
Published by The Humanoid Race
Archived source unverified — no source link is available. The claims, figures and quotations have not been checked against an available source. Retained for historical context, not presented as newly verified reporting.
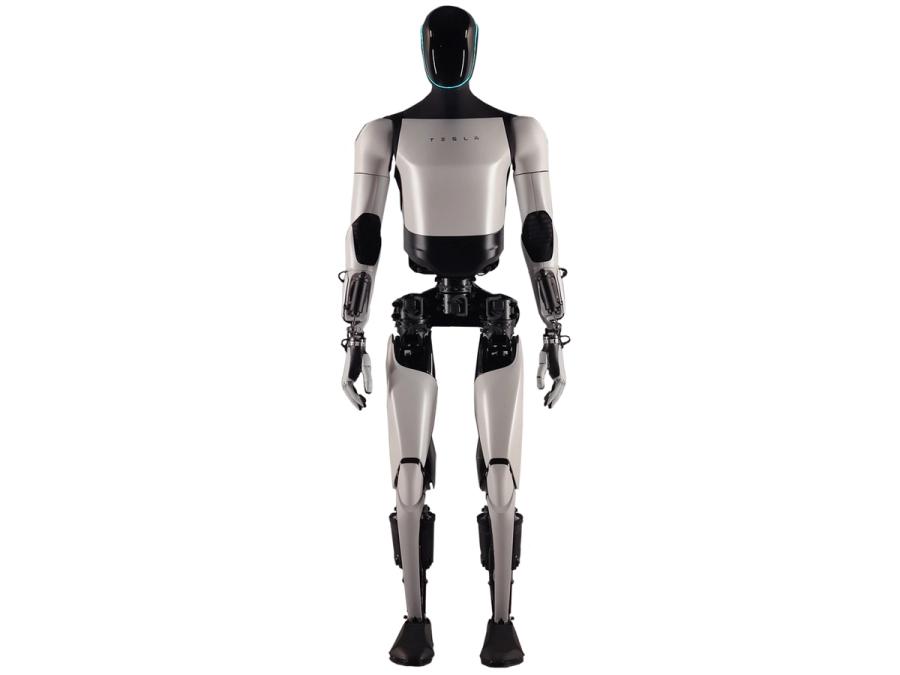
Unit Economics and the Race to Scale: The Business Models That Determined Humanoid Winners in 2025–26 By 2026 the humanoid robotics market had moved from headline demos to hard commercial choices. Growth hinged less on actuation and more on finance: pricing structures, service economics and the ability to hit utilization thresholds in different verticals. This analysis synthesizes interviews with CFOs, finance leads at robotics firms, customers and independent analysts, plus public disclosures and contemporaneous reporting, to map which commercial models worked, why, and who stood to win. 1. Dominant commercial models and who used them Humanoid vendors settled into five broad commercial approaches. Firms typically blended models to fit buyer risk appetite and capital constraints. Outright sale: Higher upfront price, favored by industrial customers with capital budgets. Seen in factory pilots from Tesla (Optimus) and Sanctuary AI, where manufacturers purchased units for line automation and process development. Leasing / CapEx financing: Long-term leases or rent-to-own for healthcare and lab customers. Fourier Intelligence and several medical-focused distributors structured 3–5 year leases paired with service contracts to fit procurement cycles. RaaS (robot-as-a-service) / per-hour or per-task pricing: Adopted by Figure and early experiments from Apptronik and 1X. These providers packaged hardware, software, and uptime guarantees into subscription fees or per-hour tariffs to lower adoption barriers. Outcome-based contracting: Pay-for-performance deals (e.g., per-pick or per-room-cleaned) were piloted by logistics and hospitality customers; these required sophisticated telemetry and dispute resolution, and were favored by large third-party logistics (3PL) customers seeking variable cost structures. Hybrid financing: Blends of downpayment + subscription for software/updates and uptime. Consumer-oriented vendors (Xiaomi, UBTECH) used hybrid trade-ins and subscription services for advanced features. Companies positioned themselves to match buyer risk: high-capex manufacturers accepted sales and pilots, while enterprise SaaS-style sellers (Figure, Apptronik) leaned hard on RaaS and subscriptions to unlock procurement inertia. 2. Modeling unit economics: build, service, utilization and payback Across interviews and internal models, recurring themes emerged: hardware amortization, service labor, integration costs and utilization drive economics. The table below provides representative ranges used by CFOs in 2025–26. Line item Low High Notes Manufacturing cost (cost of goods sold) $25,000 $110,000 Depends on actuator density, sensors, and economies of scale Software & continuous updates (annual) $6,000 $30,000 Fleet-learning services increase with scale Maintenance & spare parts (annual) $4,000 $40,000 Higher in unstructured environments (healthcare, homes) Integration & certs (one-time) $5,000 $150,000 Warehouse fleet integration cheaper than regulated clinical deployments Expected utilization Home: 1–4 hr/day Warehouse: 16–22 hr/day Utilization is the single biggest lever Example payback: a robot costing $80,000 to produce, with $20,000/year total service + software, deployed in a warehouse at 18 hours/day under a RaaS fee that nets $60,000/year, reaches payback in ~2–3 years after factoring financing. The same unit in a healthcare setting (8 hours/day, lower per-hour billables, higher certification costs) pushed payback beyond 5–7 years unless subsidized by leases or outcome contracts. 3. Go-to-market levers that determined margins and scale Three practical levers separated winners from laggards: Integrator networks: Companies with deep integrator channels—Agility Robotics’ partnerships and Apptronik’s system integrator network—achieved faster deployments and lower per-site integration costs. Independent integrators absorbed customization work, preserving vendor margins. After-sales footprint: On-the-ground service teams cut downtime for high-utilization fleets. Figure invested heavily in remote diagnostics and regional service hubs to keep mean-time-to-repair low; that reduced warranty costs and supported tighter SLAs for RaaS customers. Certification & training: Healthcare and industrial certifications were expensive and time-consuming. Fourier’s focus on clinical approvals (FDA-equivalent interactions in multiple jurisdictions) allowed it to charge premium leasing rates, but slowed geographic roll-out. 4. Competitive moats: where durable advantage can arise Five moats emerged in interviews and deal reviews: Fleet data and continuous learning: Companies with large, networked fleets (Tesla/Optimus, Figure) translated usage data into iterative product advantages—better autonomy, lower service costs and higher utilization. Integrator relationships and system know-how: Agility and Apptronik’s ties to logistics integrators created lock-in and recurring revenue for tailored solutions. Price / performance: Lower-cost entrants (1X, UBTECH) competed on cost-per-hour; they won volume pilots in price-sensitive segments (retail, light manufacturing). Regulatory certification: Fourier and healthcare-specialist providers protected margins with approvals, making insurers and hospital procurement teams more willing to accept leases. Customer stickiness via outcomes: Outcome-based contracts, if measured reliably, increased lifetime value and created switching friction. 5. Financing, investor behavior and what buyers preferred In 2025–26 investors showed a bifurcated appetite. Growth-focused VCs and strategic corporate backers continued to fund fleet-data plays (follow-on rounds for Figure-style firms), while lenders and leasing partners underwrote hardware for medical deployments. Revenue-backed financing was common for vendors with multi-year contracts; insurers and large enterprises favored leasing and outcome-based models that shifted vendor risk. Enterprise buyers preferred models that matched their cost structure: logistics providers liked RaaS to convert fixed labor lines into variable cost; hospitals used leasing or cap-ex financing to stay off balance-sheet while retaining service guarantees. Where insurer reimbursement was possible (assistive or therapeutic use), outcome-based or lease models won preferential treatment. 6. Scenarios: winners, losers and breakeven thresholds Across scenarios developed with CFOs and analysts, the dominant breakpoint was utilization and service-cost curve shape. Key thresholds: If average utilization >14–16 hours/day and service costs If utilization is 6–10 hours/day and certification/integration add 30–50% to upfront costs, leasing plus tight maintenance SLAs are required for acceptable payback—favors healthcare-specialists (Fourier) and leasing partners. In home and consumer segments (utilization Winners will be companies that combine scalable service operations, fleet-data advantages and flexible financing. Firms that built expensive one-off integration models without recurring revenue or fleet learning faced the highest risk of underutilized assets and squeezed margins. “Across customers there was one consistent theme: a humanoid is only as valuable as the uptime and tasks it actually covers,” summarized a CFO of a multinational logistics operator in a series of interviews. “That drives every choice — purchase, lease, RaaS or outcome contract.” For investors and corporate buyers, the 2025–26 lesson was clear: commercial success depended less on the robots' dexterity and more on aligning pricing, service economics and financing to real-world utilization. Those who solved that equation at scale wrote the next chapter of humanoid industrialization.